Brian Sheehan on January 15, 2013
 Using the Gantt Chart
The Planio Gantt Chart is a schedule management tool for visualizing multiple issues and projects in terms of overall progress, time spent, and current status. Thanks to Planio's filtering capability, coupled with the chart's tight integration with the issue management features, the Gantt Chart gives you an opportunity to view mission critical data on-demand.
We'll start by taking a brief tour of the interface, after which we'll look at how to work with filters. We'll also touch on the great zoom and export functionality. So, let's start with a look at the Planio Gantt Chart:

Interface
Current Filter Section
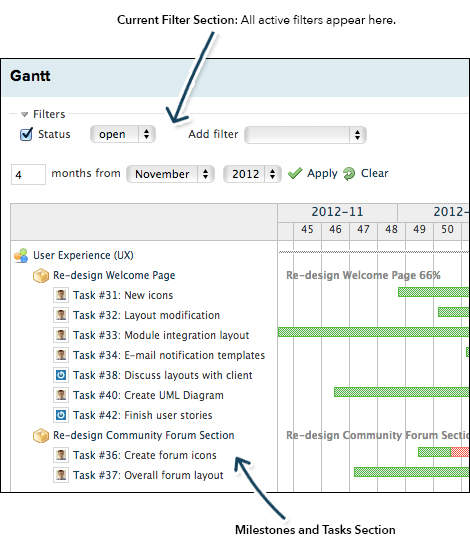
The graphic below features the Current Filters section, which is where all current filters are listed — we will discuss how to add filters in a moment. Each filter, after being selected, can be toggled on or off so that you can see their effects on the Gantt Chart. Examples of the types of filters available include tracker, priority, assignee, due date, and percentage done.
Milestones and Tasks Section
On the left side of the Gantt Chart is the milestones and tasks section. As its name implies, this area lists the project name  , milestones
  , and the tasks (gravatar icon of the assignee -
  ) that are associated with each milestone. Each task is clickable and links back to its Issue Details page.
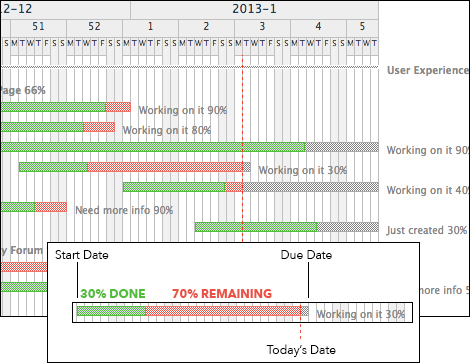
Gantt Chart Content
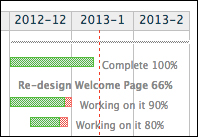
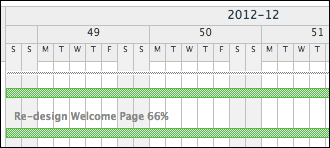
The Gantt Chart uses colored bars to represent the progress of individual tasks, as shown in the graphic below:
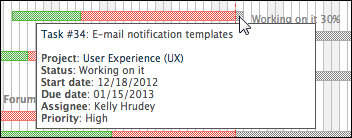
Additionally, a tooltip box appears showing task details when your mouse cursor hovers over a bar:

How to Use Filters
There are 20 filters available for use in the Planio Gantt Chart, which means you can have hours of fun refining your charts while determining the exact configuration that works best for your organization. Selected filters work alongside a static date filter that enables you to specify the number of months to display from a set month/year.
Creating a Filter
Here's a walkthrough about how to create a new filter:
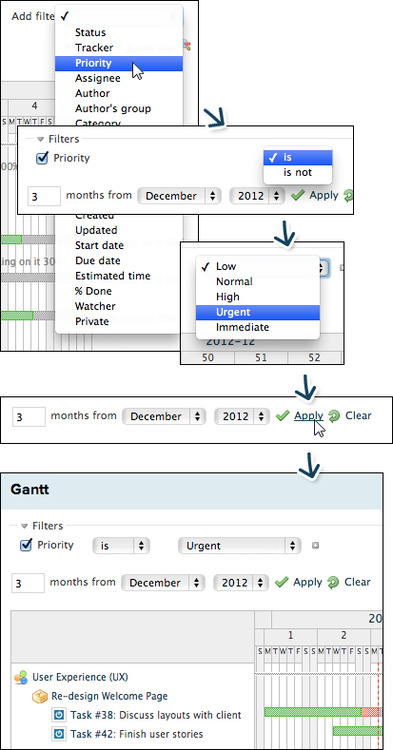
- In the Add Filter field, select the new filter from the drop-down list — in the graphic below, we selected Priority.
- The filter name, a conditional operator, and a selectable/definable field appear. The types of operators vary depending on the filter — they may be as simple as "is | is not" or more complex, such as ">= | <= | between | in less than | in more than" and so on. Select the most appropriate operator — for this example, we selected is.
- In the selectable/definable field, select or enter a criteria to filter by. In the example graphic, we selected Urgent to create a Gantt Chart that will only display tasks that have an "Urgent" status.
- In the text field, enter the number of months to display in the Gantt Chart.
- In the month and year fields, select the month & year combination that correlate with the number of months you just entered. In this example, we will display the last 3 months from December, 2012.
- Click Apply.
- The Gantt Chart will update with your defined filter. If you wish you can add more filters using the process just described.
To toggle a filter on or off, simply select (or de-select) the check box to the left of the active filter.

Using the Zoom
The Zoom In|Out tool enables you to view different time periods within the Gantt Chart. The different zoom interfaces include:
Year and Month (Maximum Zoom Out)
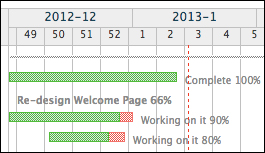
Year, Month, and Week of the Year (Default view)
Year, Month, Week of the Year, and Day (Narrow view)
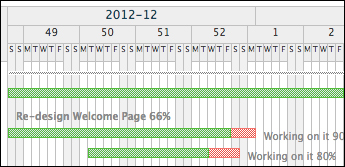
Year, Month, Week of the Year, and Day (Wide view: Maximum Zoom In)

Export
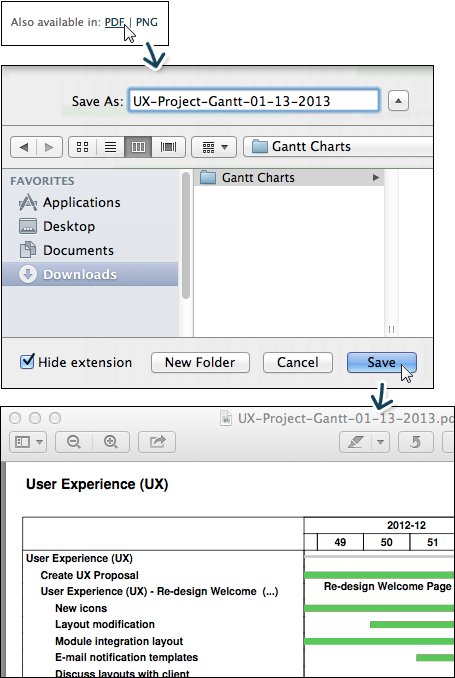
The Planio Gantt Chart can be exported to both PDF and PNG (image) formats. Simply click either PDF or PNG, as appropriate, on the bottom right corner of the Gantt Chart screen. The current view is exported, so be sure to confirm that your Gantt Chart looks the way you want it to prior to exportation.

Was this article helpful? What other Planio functionality would you like to see discussed? Tell us about it via a comment below. Feel free to share a Like and Tweet as well!
When not enjoying a great dinner at his favorite Italian restaurant, Brian enjoys cooking, writing, and relaxing by the beach.